Now it is becoming a little more clear. The qqqq's have not created a double bottom. The spy and dia are starting to form a symmetrical triangle (see here for a definition http://stockcharts.com/school/doku.php?id=chart_school:chart_analysis:chart_patterns:symmetrical_triangle )
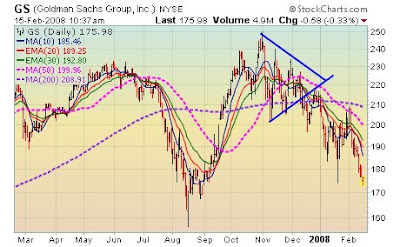
Below is an example of a symmetrical triangle in gld that is a continuation pattern. Notice the triangle that formed in Nov-Dec last year. In this case it broke out of the upper trend line and never tested the trend line. Note in this case that there was a much more well defined trend in place when the triangle formed. Also notice that another triangle is forming as we speak.

The crux of the matter is that it may be difficult to predict the direction the stock or market will move after a symmetrical triangle forms. The most important thing is which way it breaks. It is also nice if it tests (and passes) the broken trend line but as with gld this does not always happen.
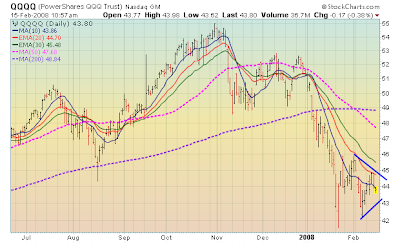
Back to the major indices or their tradable cousins their tracking etfs. Looking at the qqqq's we see a potential symmetrical triangle forming. The double bottom never formed. Also there is not a good place to draw a trend line and if you did it would be very steeply down, almost unsustainable down. So now I believe the potential is for the symmetrical triangle reversal pattern to form. Note this pattern is also forming in the dia.
Looking at the dia below we see a similar pattern forming. Although in this case there is a little more definable downtrend line that can be drawn.
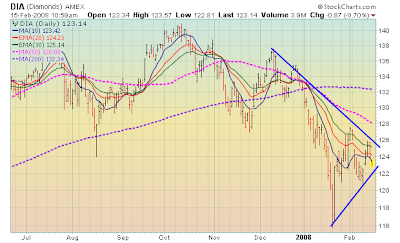
The conclusion is that we are now seeing the major indices correlate in that they are all consolidating. They are all making a similar symmetrical triangle pattern. While we cannot know which way we will break from this consolidation, we do know what to look for. We look for a breakout and based on the direction we can get a sense of the direction of the next move. Since these are major indices I would expect a break and then test. If the test confirms the breakout then another significant move up of down can be expected.
On another note. When you look at the gld chart above we see another triangle forming currently. It looks as if it will break to the upside again. But I do have to wonder how much further gld can go without a major correction. It has had a very big run.
--
No comments:
Post a Comment